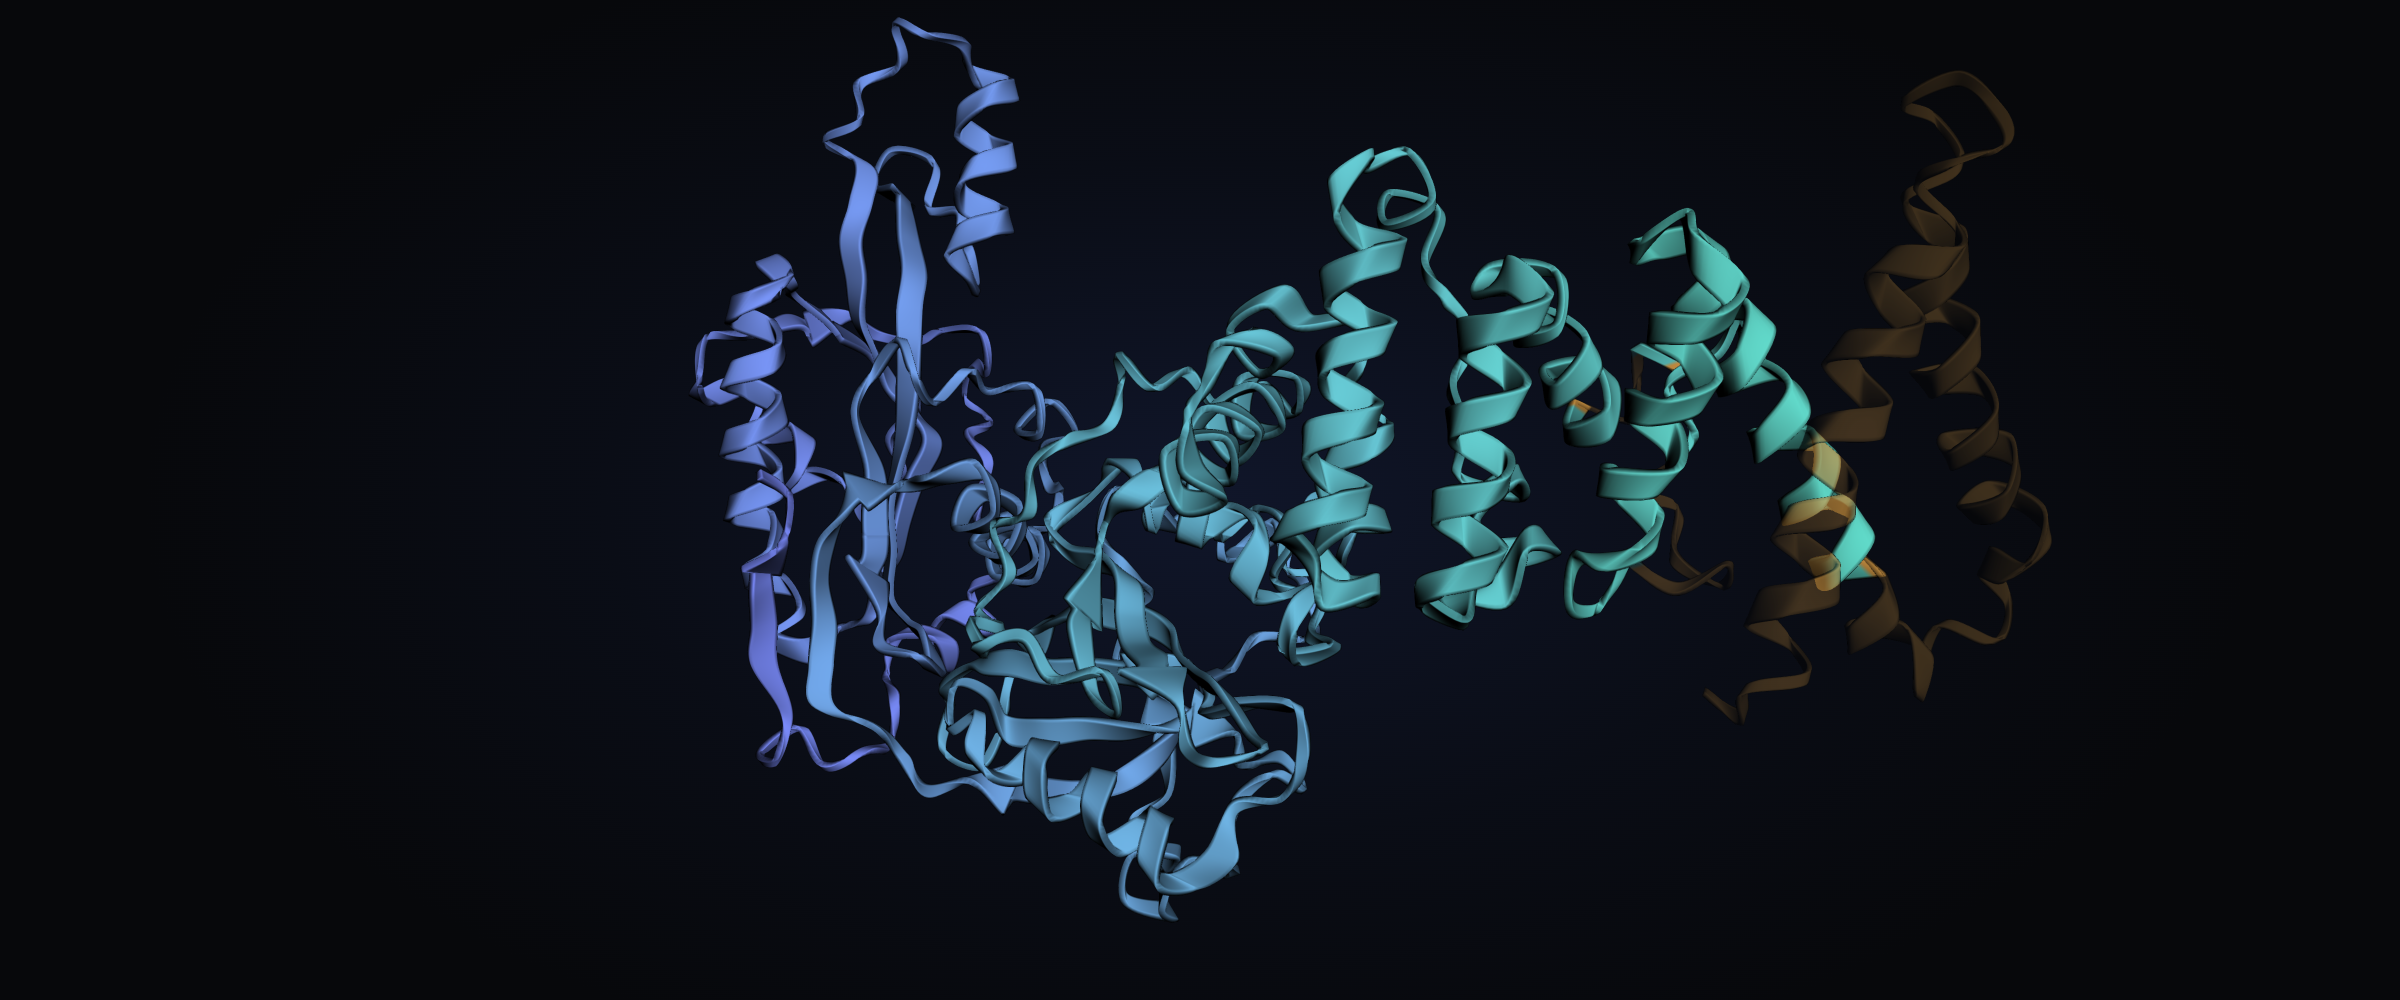
The first time our ART search reached a locus with a repeat array, we did not yet know which example in the paper it might be. We had followed the published sequence clues into a public metagenomic catalog, found a reverse transcriptase and its neighboring partner gene, and examined the DNA upstream. Only afterward did we compare the result with the paper’s printed sequences and diagrams. The locus corresponded to L0050, the study’s representative example, or a very close variant.
That was the starting point for a broader reproduction effort. We went on to recover other illustrated cases, extend truncated contigs using sequencing reads, and confirm array-bearing members of a lineage whose fingerprints did not match the displayed loci. The work also exposed a practical limitation of genome mining: a search can find the right protein while the assembly leaves too little surrounding DNA to assess the locus.
This post describes what we reproduced, how the evidence accumulated, and where the conclusions stop.
From the paper to an independent search
Anthropic’s researchers reported array-associated reverse transcriptases (ARTs) in Autonomous AI agents discover reverse transcriptases with tandem repeat arrays. Their work identified an association between an RT-encoding gene, a dedicated neighboring partner gene, and an upstream repeat array. Credit for that discovery belongs to the original research team.
Our question was whether we could build our own analysis environment from the published methods and recover ART-associated loci in public data without using the illustrated loci’s accession identifiers as search targets.
We started with the paper’s published RT seed sequences. We aligned them, constructed a family profile, and searched public protein catalogs. Candidate RTs were compared with other known RT families before we returned to their contigs to examine neighboring genes and upstream DNA.
The workflow moved through four stages:
- Implement the published family definition. Build the sequence-search environment from the public seeds and methods.
- Search public data. Collect protein candidates and distinguish ART-family links from other RT families.
- Inspect the locus. Evaluate the RT, neighboring partner, and upstream repeat array together.
- Compare afterward. Check the saved results against the paper’s printed sequences and diagram-derived fingerprints.
The independence here is in the implementation and execution of the search. We used the original paper’s seeds and methods; we did not rediscover the system without prior knowledge or replicate the original research environment in every detail. Nor did we conduct an access audit that would establish strict non-viewing of the figures. Our supported claim is narrower: the illustrated locus accessions were not supplied as retrieval targets, and the correspondences were established by subsequent comparison.
A protein’s connection to the ART family was only the beginning. It did not, by itself, establish an array-bearing locus. We assessed the family assignment, partner gene, and upstream array separately, leaving candidates unassessed when the available DNA was too short or the data were incomplete.
The first hits led back to the paper
The first substantial result came from a metagenomic assembly in the GEM catalog, Genomes from Earth’s Microbiome. It contained an RT, a neighboring partner gene, and an upstream array with 14 repeat copies. We had reached that DNA context through a protein search.
We then compared the repeat sequences and their flanking DNA with the sequences printed in the paper. Their order and flanking-sequence correspondence, together with gene lengths and repeat spacing, linked the GEM result to L0050 or a very close variant. That does not establish nucleotide-for-nucleotide identity with the paper’s original assembly: different assemblies may represent the same or closely related biological material.
Two loci found in Logan, ERR8055547_17666_12 and SRR8925777_19762_9, also corresponded to published examples: ART_34 and ART_69, respectively, in the supplementary diagrams. In total, 3 initial direct-search results were classified as reproductions of illustrated cases.
Once those correspondences were established, we removed the loci from the list of potentially new candidates. They became reproduction evidence. A match to a published example demonstrates that the workflow reached a relevant locus; it does not make that locus a new discovery.
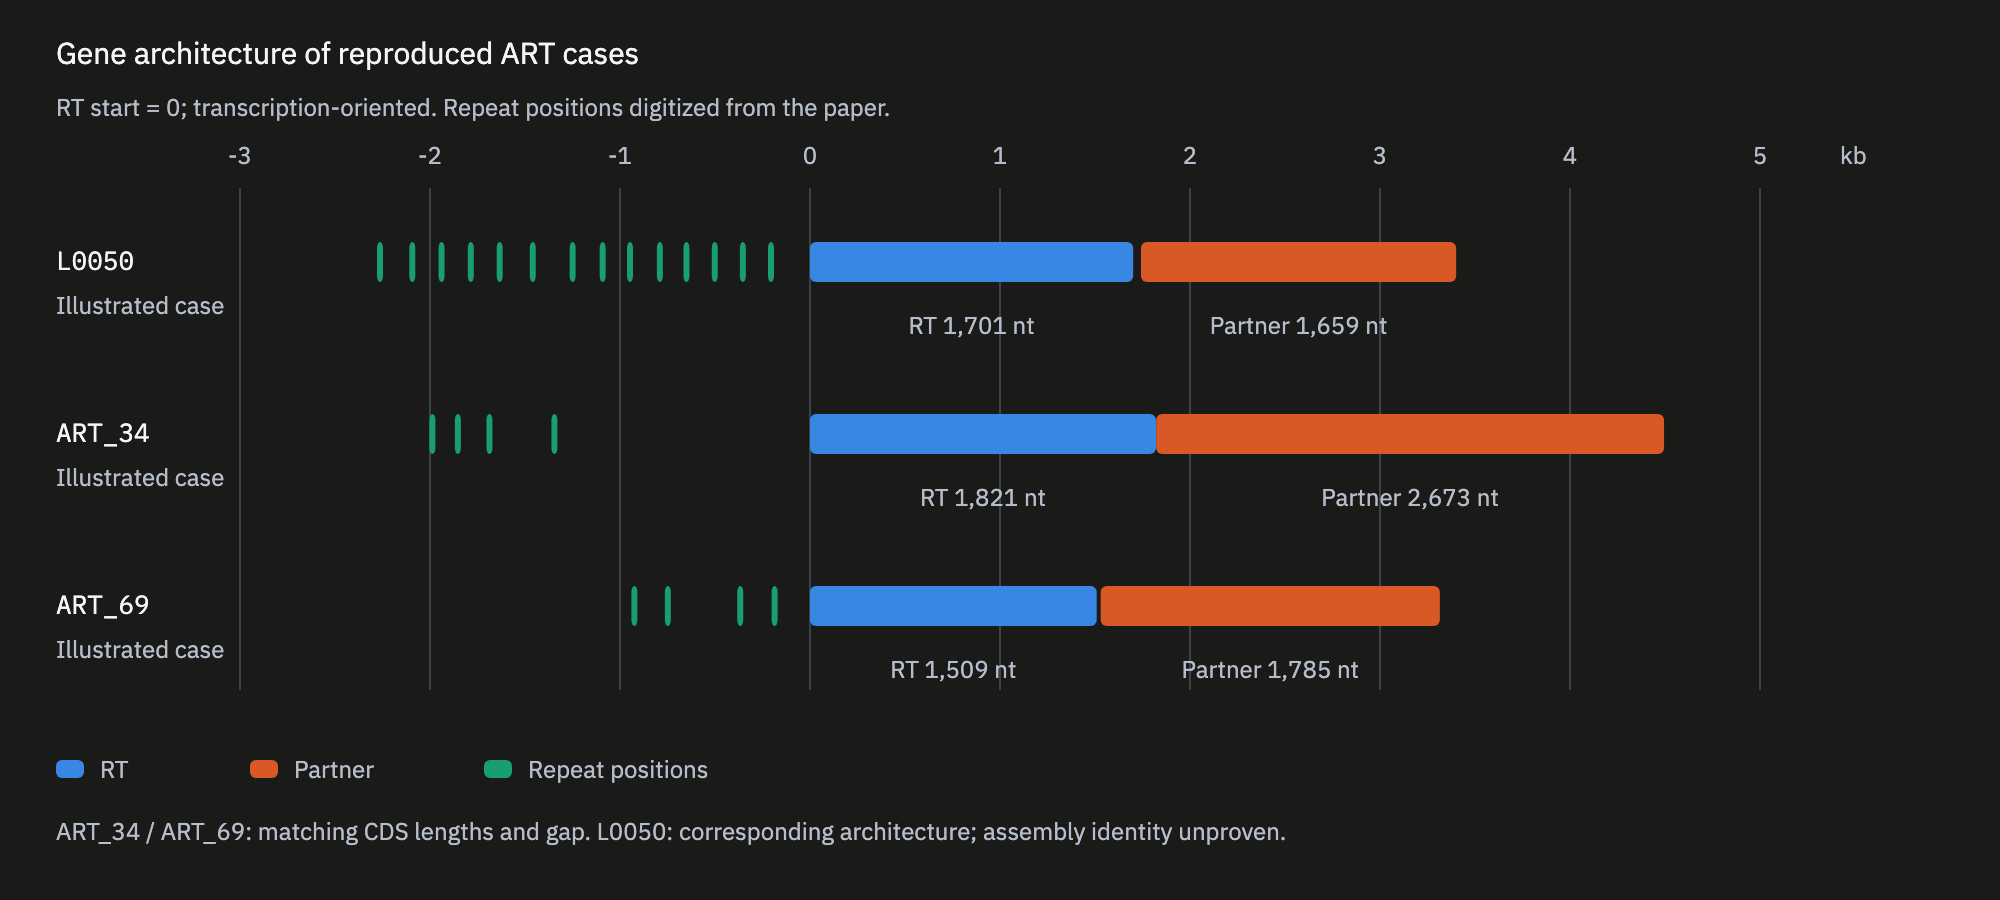
Gene architecture, compared after retrieval. Repeat positions and gene lengths extracted from the paper’s diagrams are redrawn on a common scale. After harmonizing stop-codon conventions, our ART_34 and ART_69 coding-sequence lengths and RT–partner gaps matched the diagram values. L0050 is a sequence-and-architecture correspondence, not proof of an identical original assembly.
Repeat spacing provided a second fingerprint
Protein lengths can coincide by chance. An ordered series of repeat intervals carries additional information. For ART_34, 3 consecutive intervals matched the displayed values; for ART_69, 3 consecutive intervals did. We retained the full interval series, including additional repeats called by our detector but not shown in the corresponding diagrams.
L0050’s observed spacing series also closely matched the diagram-derived series. The largest difference was 4 nt. Because the comparison involves coordinates read from a diagram, that agreement should not be mistaken for the precision of a direct comparison between complete nucleotide sequences.
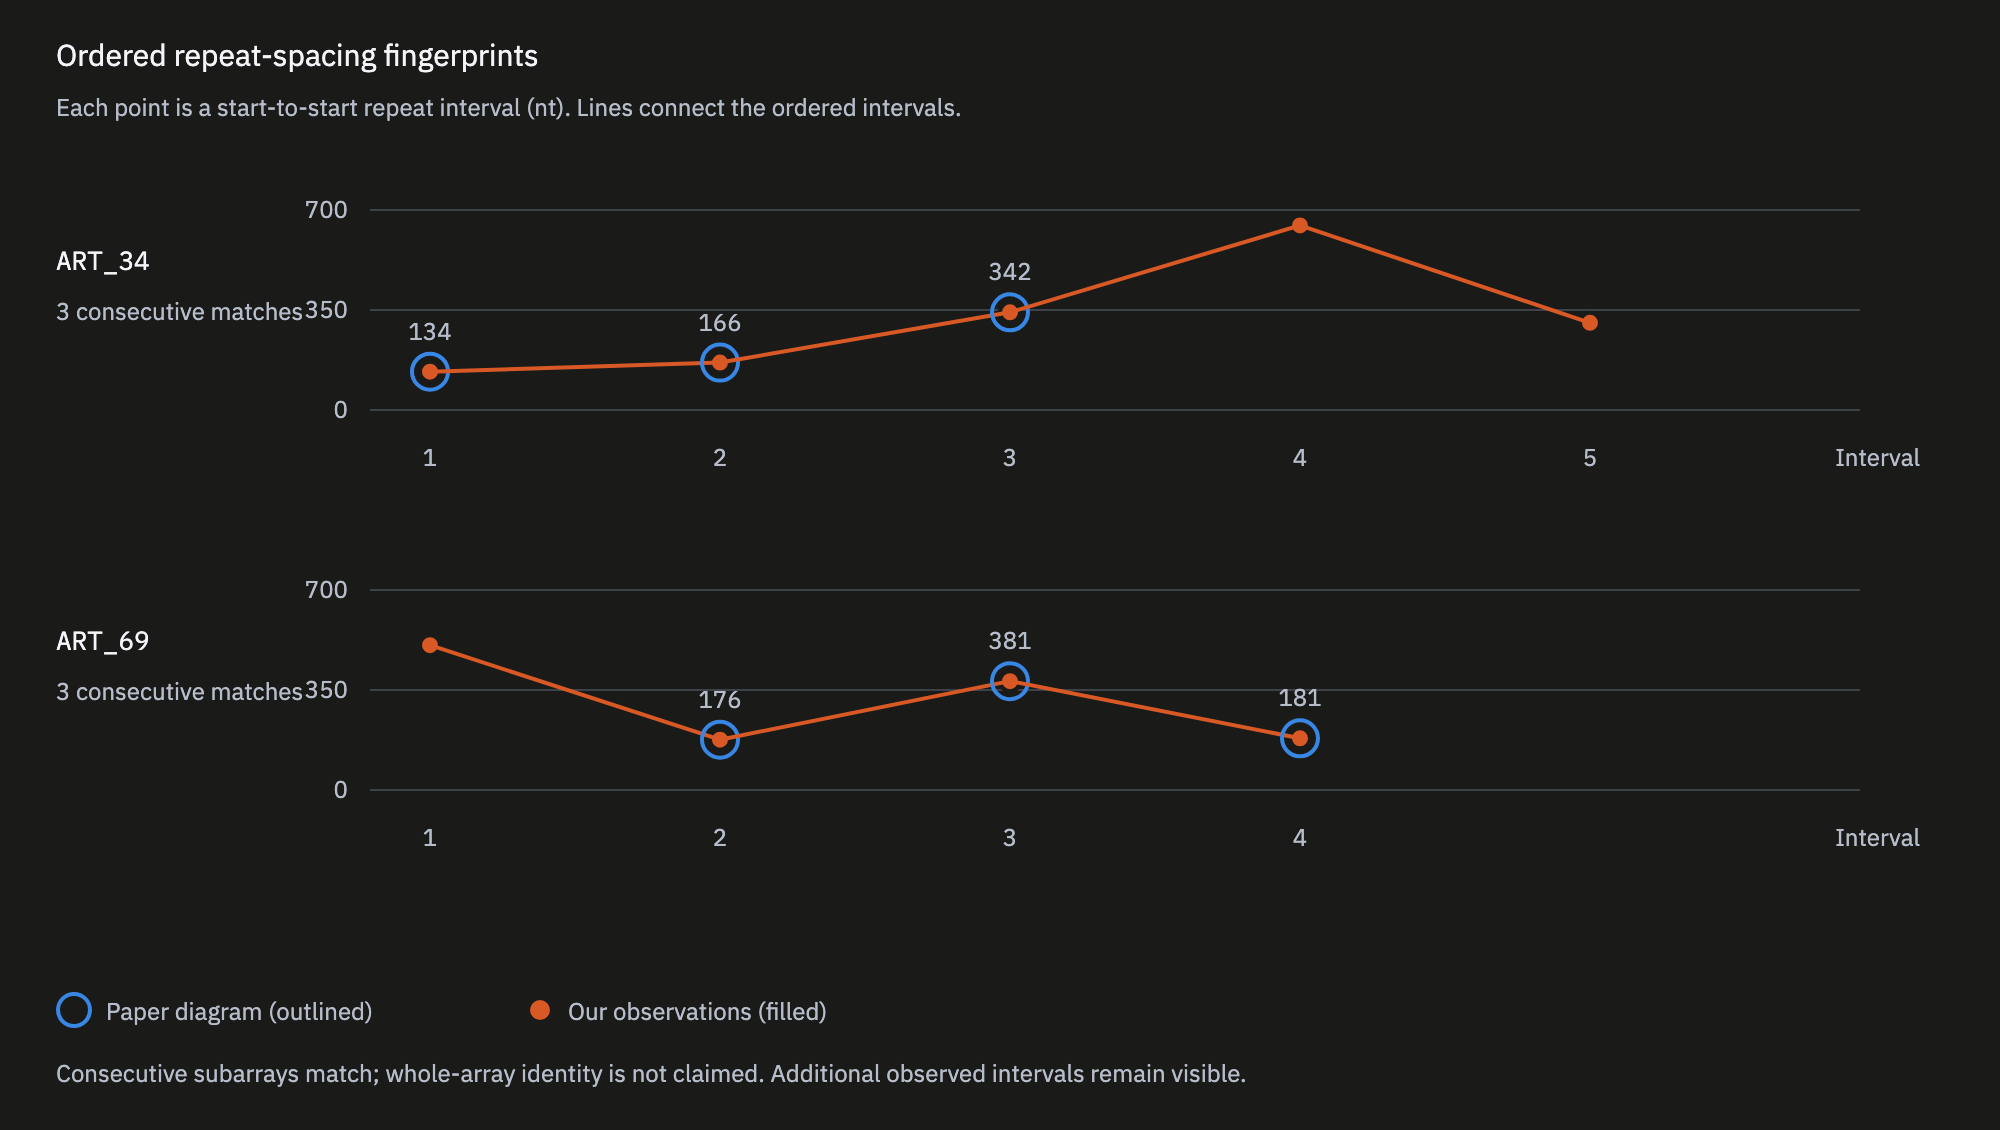
Ordered repeat-spacing fingerprints. Filled points show our observations; outlined points show the matching diagram intervals. The agreement concerns a consecutive subarray, not identical calls across the entire array. Additional observed intervals remain visible. Each case is compared with its own published fingerprint, rather than with a single repeat motif imposed across different lineages.
Short contigs concealed upstream arrays
As the search expanded, we accumulated candidates with an ART-linked RT and a partner gene but insufficient upstream DNA to evaluate an array. A truncated contig could not tell us whether an array was absent or simply outside the assembled sequence.
We therefore returned to sequencing reads from the candidate’s source sample. Reads connected to the candidate contig were used to extend the upstream region. We then assessed the array in the reconstructed member sequence and remapped reads to examine coverage support.
For ERR10896470_6887_1, the initial assembly supplied only 232 nt upstream of the RT. Read-supported reconstruction increased that to 3,597 nt, exposing a repeat array. For ERR4236129_15347_m, the available upstream sequence increased from 301 nt to 3,585 nt, making array assessment possible.
Some reconstructed results corresponded to further illustrated cases. ART_38 matched in gene lengths and consecutive repeat spacing. SA1 was a near correspondence. ART_95 matched in spacing but retained a discrepancy in partner length, so we kept it as suggestive. Exact, near, and suggestive correspondences were not merged into a single confirmed category.
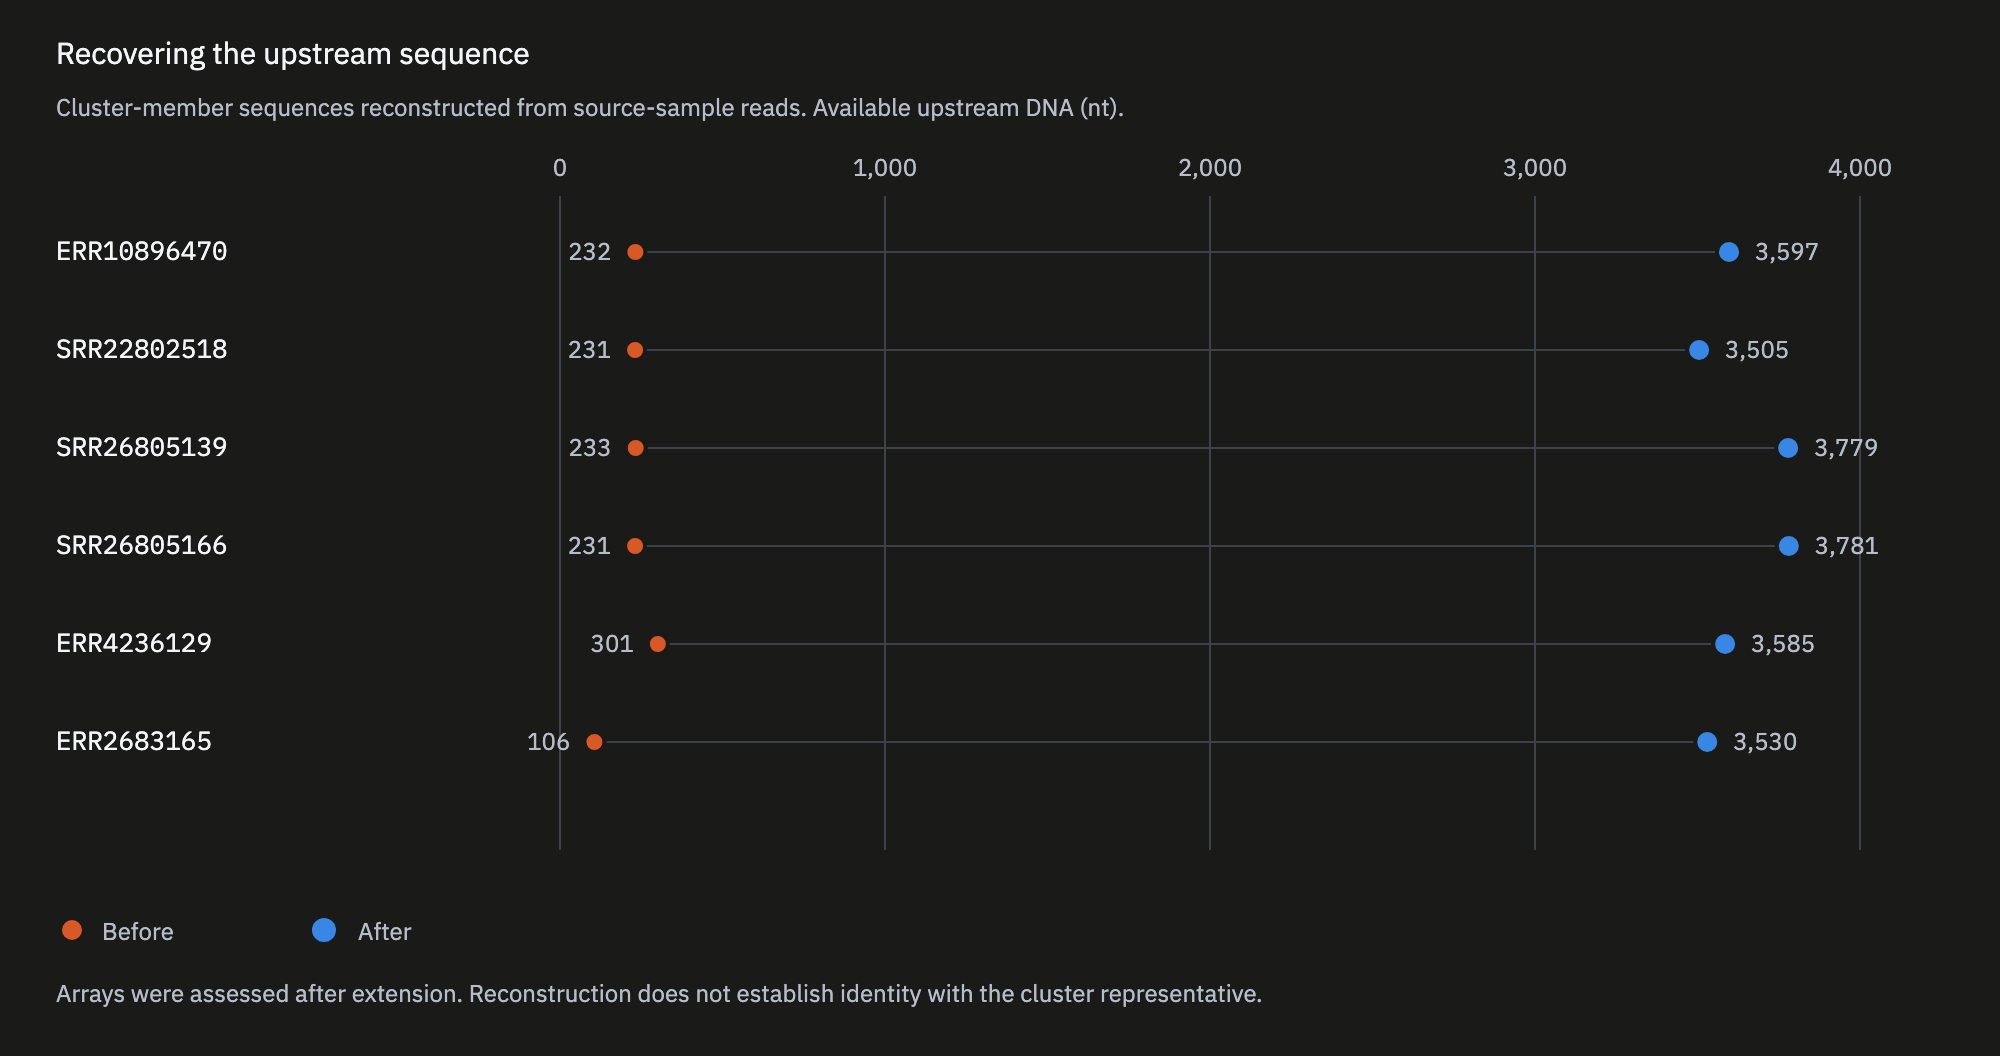
Upstream sequence recovered from reads. Each pair of points comes from the recorded pre- and post-reconstruction sequence lengths. These are results for reconstructed cluster-member sequences; they do not establish that the original cluster representative’s locus was reconstructed identically.
A lineage beyond the displayed loci
Read-supported reconstruction also revealed arrays whose fingerprints did not match the displayed examples. The ERR10896470 lineage was the clearest case. We examined its RT–partner context, repeat copies, spacer arrangement, and read-remapping support together.
In the initial completed snapshot, that lineage contributed 4 observations with strong array evidence, drawn from 3 BioProjects. Two samples belonging to the same BioProject were treated as one study unit, not two independent studies. Similar interval patterns in different source studies provide stronger support than an array observed in a single assembly alone.
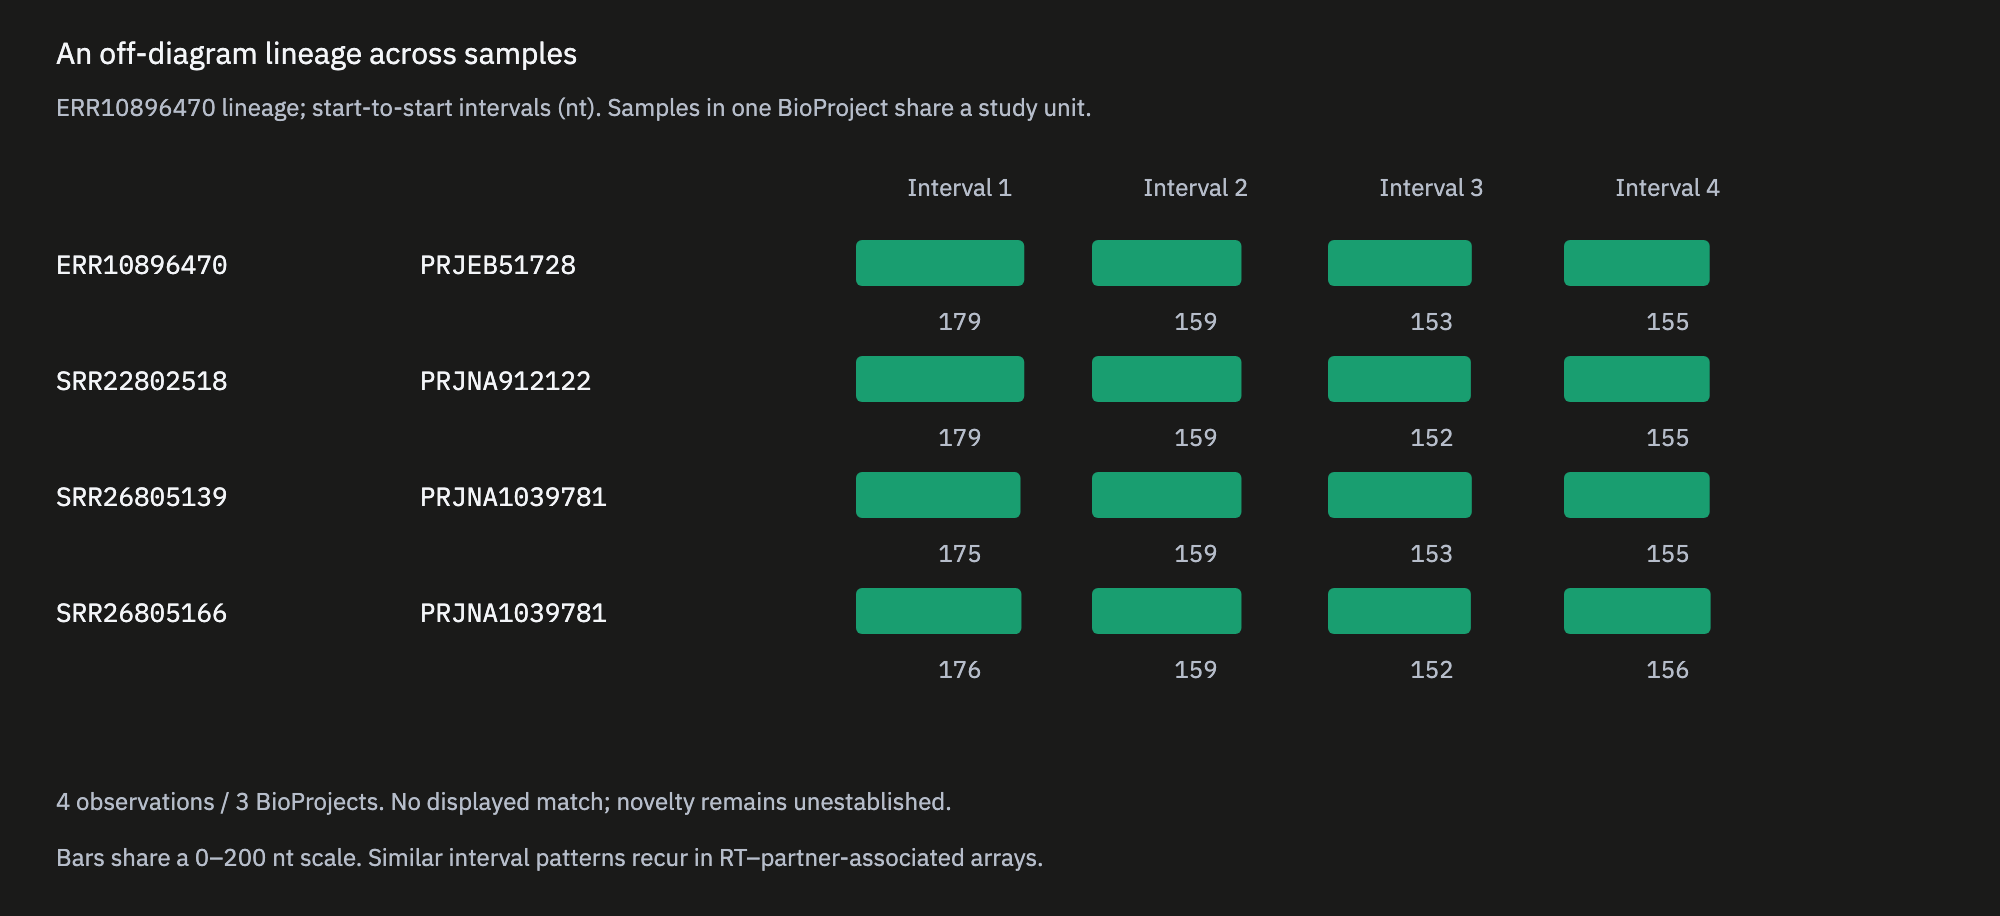
Cross-sample repeat spacing. Sample identifiers and BioProjects are shown together. All small bars use the same interval scale, and the modest differences between samples are preserved. Multiple observations within one study contribute evidence without increasing the number of independent study units.
“Beyond the displayed loci” has a specific meaning here: we found no correspondence within the printed sequences and diagram fingerprints available for comparison. It does not establish that the lineage was absent from every cluster or member examined in the original paper. We describe it as an ART-linked, partner-associated array architecture outside the displayed fingerprints, not as a first-in-the-world discovery. Its biological function remains a separate question.
Keeping the denominators straight
The initial completed read-reconstruction snapshot contained 52 unique candidate IDs. 7 were classified as having strong evidence, including reconstructed results corresponding to published cases. That number is not a count of new loci.
We retained intermediate and weak evidence, as well as no-array, unassessed, indeterminate, and unsupported-read cases. A short contig or incomplete read data did not become a negative result. Even a no-array result was scoped to the particular reconstructed sequence.
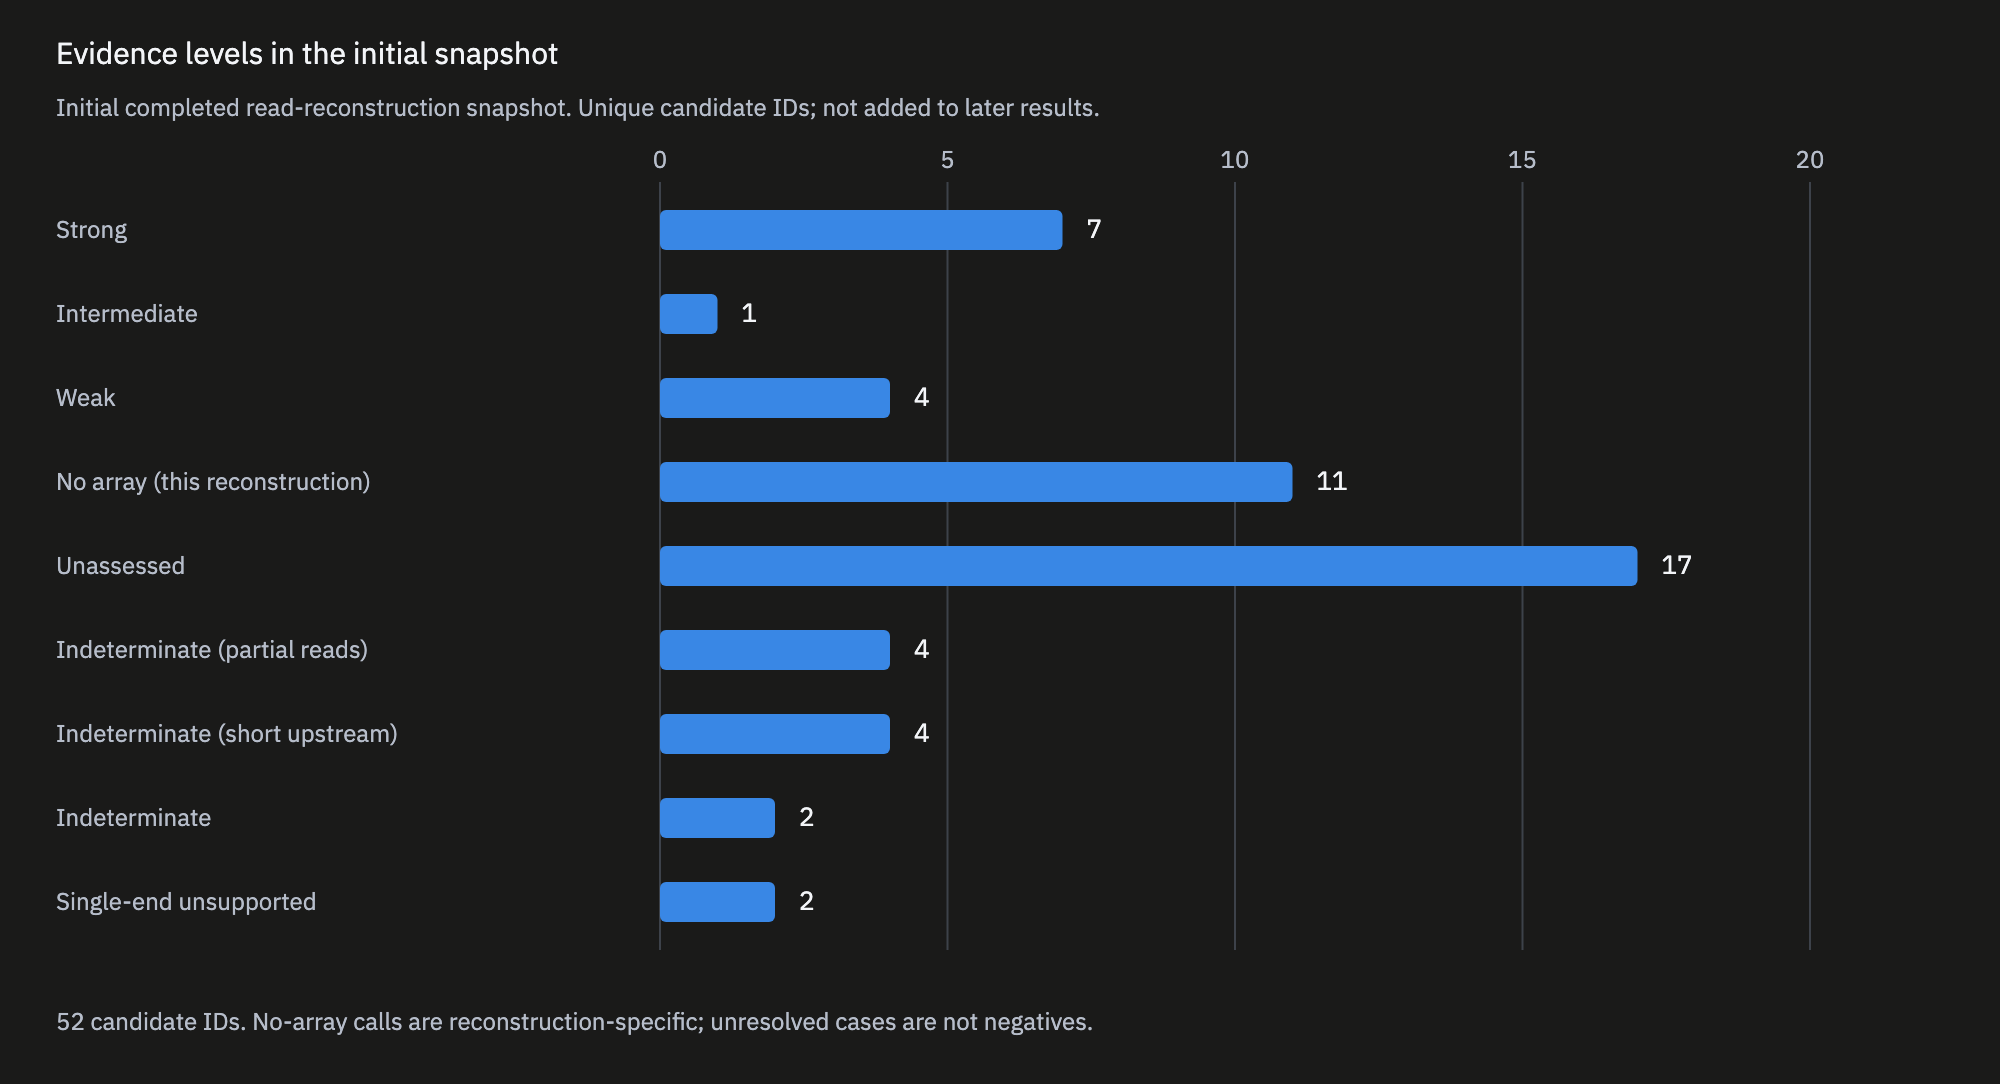
Evidence levels in the initial completed snapshot. The unit is a unique candidate ID, not a protein cluster or BioProject. This snapshot is not added to later cumulative results. “No array” applies to the reconstructed sequence; unassessed and indeterminate cases are not biological negatives.
| Evidence category | Unique candidate IDs |
|---|---|
| Strong | 7 |
| Intermediate | 1 |
| Weak | 4 |
| No array (this reconstruction) | 11 |
| Unassessed | 17 |
| Indeterminate (partial reads) | 4 |
| Indeterminate (short upstream) | 4 |
| Indeterminate | 2 |
| Single-end unsupported | 2 |
We tested the locus-confirmation limitation more directly in a follow-up study of ART-linked candidates with insufficient upstream context. Among assessable reconstructed contigs, arrays were called in 15 contigs from 8 BioProjects.
This supports the interpretation that missing upstream sequence had concealed arrays in the tested sample. But these calls included borderline results, some large read datasets were not tested, and reconstruction failures and short upstream sequences remained. We did not convert the result into a positivity rate for the entire candidate pool or a count of strongly supported new loci.
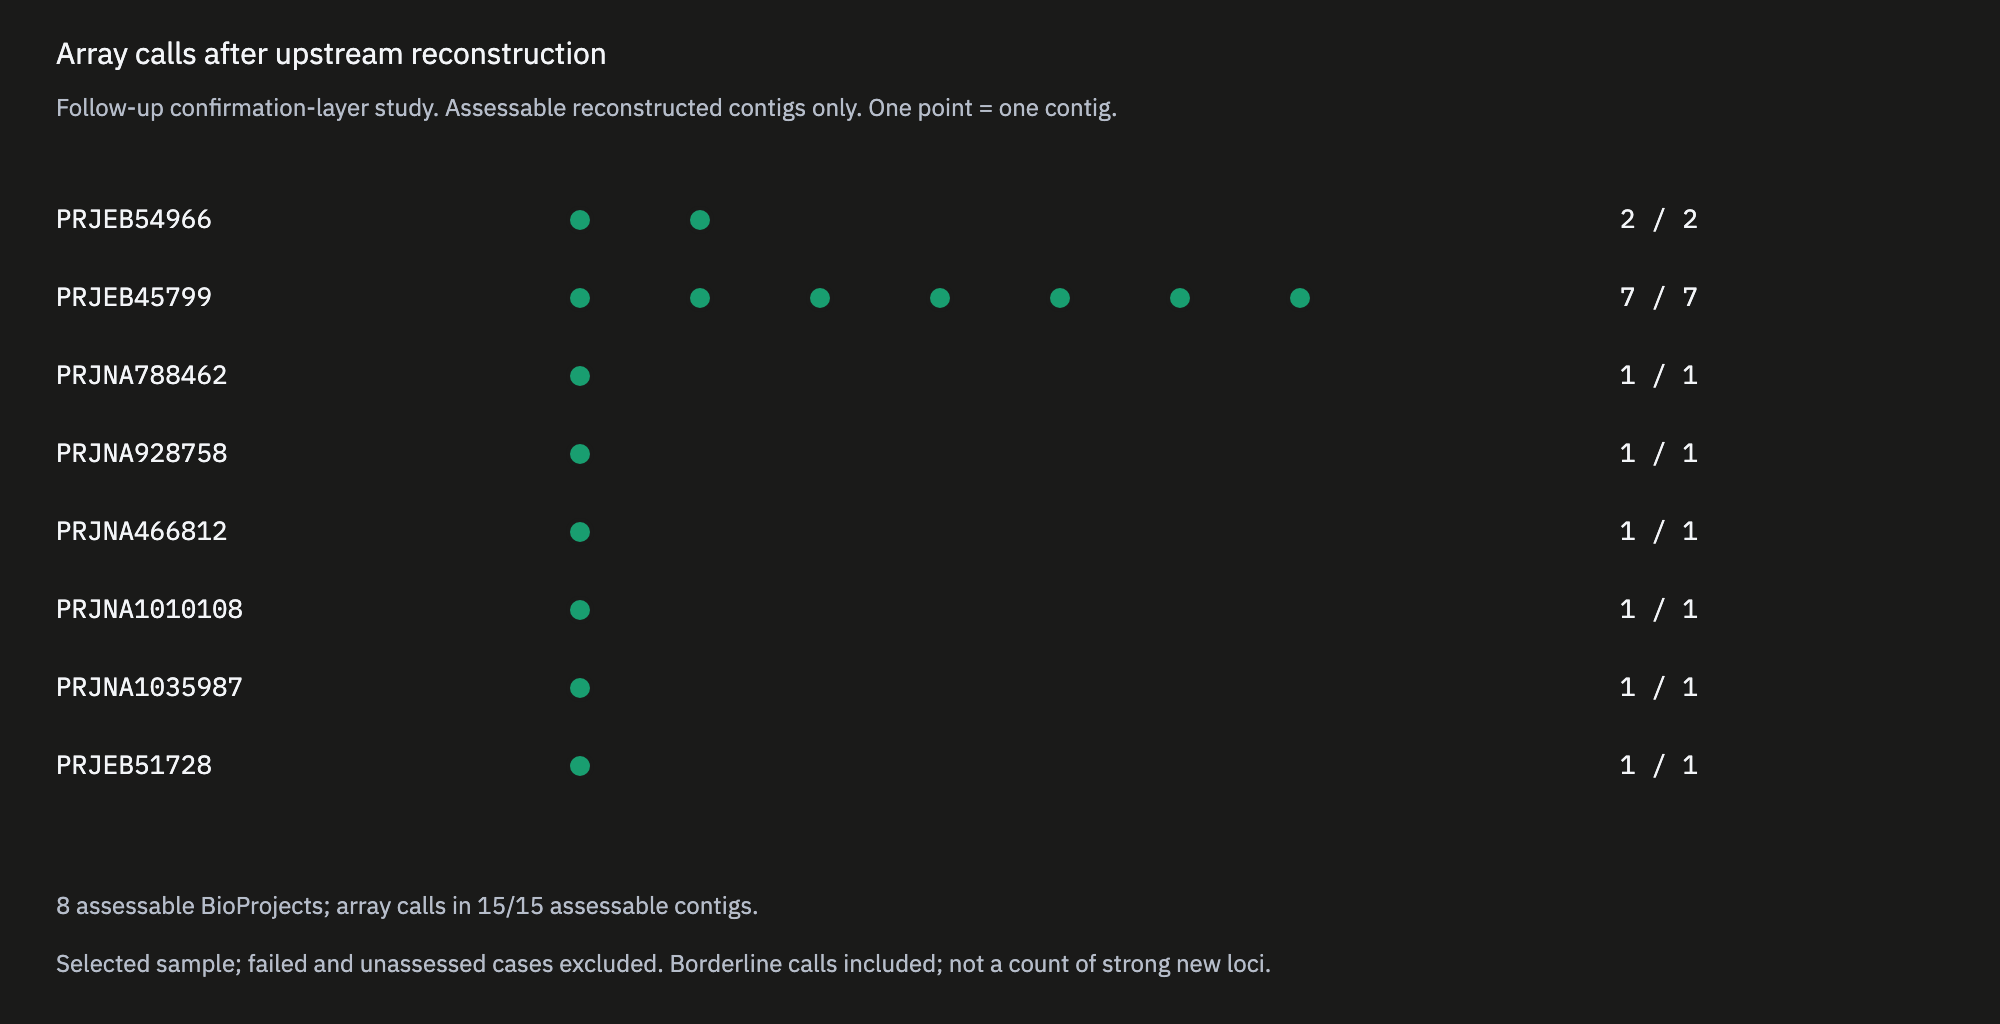
Array calls after upstream reconstruction. Each point is one assessable contig, grouped by BioProject. Several points can belong to one study. Failed and unassessed cases are outside this denominator, and not every array call meets the strong-evidence classification.
What the reproduction does not establish
We did not recover every illustrated case. In a later, figure-informed sensitivity diagnostic, exact or near recovery was 6/26 within the defined evaluation set. That diagnostic was performed after the initial search with knowledge of the diagrams; it was not a blind-search result.
The workflow is therefore not established as a complete detector for all ART lineages. Sequence and assembly analyses alone do not establish the additional architectures’ expression, reverse-transcription products, or role in phage infection. The original study’s experimental evidence must also be distinguished from our independent computational results.
A reproducible path back to the locus
The decisive moment in this project came after the search: a locus retrieved from public data corresponded to the paper’s printed sequences, gene architecture, and ordered repeat intervals. We documented that correspondence and reclassified the candidate as a reproduction.
We then improved the workflow where the data had stopped short. Extending upstream sequence exposed arrays that could previously not be assessed, and similar architectures reappeared in samples from different studies.
For AI3 Discovery, this is the practical value of the effort: a workflow that moves from a protein candidate back to its source DNA, tests whether the surrounding architecture recurs, and distinguishes a reproduced case from additional evidence. Its credibility depends on preserving failed and unassessed results alongside the matches.
Related research manuscript
In a separate study, we enriched the alignments of ART-associated partner proteins with public homologues and measured a confidence gain against a shuffled-row control. We then compared how different methods read the predicted structures. Read the research overview and English/Korean PDFs, with checking data on Zenodo. This is a self-published manuscript, not independently human peer reviewed. The confidence gain is not a domain-count or enzyme-activity determination.
Sources and scope
- Yoon PH, Athukoralage JS, Ameisen E, Kauderer-Abrams E, Perry NT, Durrant MG. Autonomous AI agents discover reverse transcriptases with tandem repeat arrays. Original paper · Anthropic’s research announcement. The original discovery is credited to this study.
- GEM: Nayfach et al., A genomic catalog of Earth’s microbiomes. Our GEM result is an assembly-derived correspondence; identity with the paper’s original assembly has not been established.
- Logan: Public sequence-assembly resource. Read-supported results refer to reconstructed member sequences. BioProjects were used to group observations by source study.
Figures were generated programmatically from preserved analysis outputs and completed result tables. The paper’s diagrams were used for subsequent comparison and later diagnostics. Strict non-viewing of the figures was not established by a blinded access audit. This report makes no claim of a newly established biological function or a world-first discovery.
Research harness and AI use. This work used AI3 Discovery’s scientific research harness to coordinate sequence searches, computational analysis, evidence checks, and the preparation of this account with AI coding and analysis agents. The harness brings these steps into a traceable workflow, with results checked against source data. Automated checks and AI review do not replace independent human peer review. AI3 Discovery is responsible for the published content.
| Explore what AI can make possible in your research |
|---|
| AI holds enormous potential for scientific research. AI3 Discovery welcomes researchers and laboratories interested in putting that potential to work through collaborative research. If you have a scientific question, a dataset to investigate, or an experiment to connect with computational analysis, we would like to hear from you. Contact: [email protected] |